The criminal the luminary Rev. Dr. King has a lot to teach us, including to avoid the worst argument in the world.
I was heartbroken to see this rampant racial segregation in America, on MLK Day no less!

I was informed by WordPress that some of the ad revenue on Putanumonit will begin to accrue to yours truly. I assume that beforehand your monetized clicks were simply drifting into the dark abyss. I reiterate that the financial goal of this blog is strictly to lose money, I will drink away donate to charity whatever ad-pennies accumulate.
Here’s the full, easy to browse archive of Putanumonit. I’m trying to get y’all to use the comments there for topic suggestions, so far to no avail.
Remember how the tails of a bell curve drop off much faster than you ever imagined (and that’s why China is bad at soccer)? Even Francis Galton, a founding father of statistics and sampling theory didn’t fully grasp it.
SlateStarCodex breaks down another abuse of statistics by the media, this time by a right-wing source to show political neutrality. Since I care more about meta politics than about politics I don’t worry about the latter, and I also assume a priori that any article on a political site is probably using numbers to bullshit. If I ever come across a political article that uses sound, well-interpreted data to make an unbiased analysis that would be newsworthy enough to write about. I’ll try to go after tougher targets: published scientific research and those in the media who should know better.
Speaking of 538, Walt Hickey wrote a couple of pieces on estimating the number of Powerball tickets sold. His original model (which made perfect sense given the data at the time) was of exponential growth, where doubling the jackpot would more than double the number of tickets. Faster than linear growth would mean that there would be an optimum jackpot beyond which each participant’s winnings will decrease as the prize increases.
However, the two recent mega-jackpots don’t bear out that case, with Wednesday’s Powerball topping out at 635 million tickets. That’s 3 tickets per adult in the United States, but still below exponential. I fit a linear regression model of the number of tickets sold based on the size of the jackpot and the number of news articles about Powerball for each drawing.
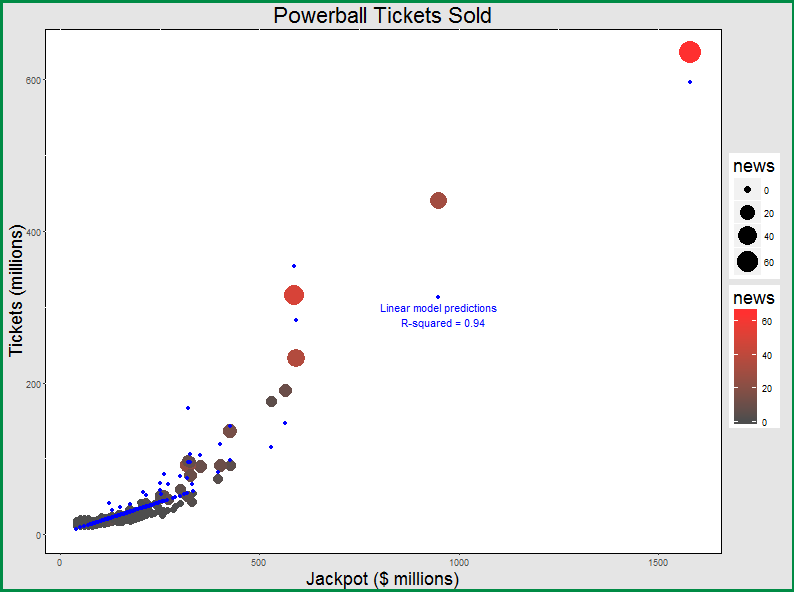
I have included all data since Powerball switched to $2 tickets in January 2012. Data from 1/2012-4/2013 are adjusted for the fact that California joined Powerball on 4/10/2013 and has since accounted for almost 11% of ticket sales.
The model gives a baseline of 7.5 million tickets for a minimal $40m prize (actual minimum is around 10 million) and 170,000 extra tickets for every $1m in the pot. Every news article (which tend to materialize when the jackpot is the “biggest ever”) inspires 5 million tickets, or one extra winner per 57 news stories.
Based on these numbers, can a jackpot grow large enough to provide a positive expectancy on your money? Before I answer that, there’s another important point to examine.
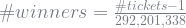
In a lottery with 600 million tickets sold and 1 in 300 million odds of winning, we expect to have two winners on average. Imagine discovering that you have won the lottery, how many people do you expect to share the prize with? Many people can’t get over the intuition that there should be one more winner besides them, but that’s not the case: given that you won you should expect two additional winners!
The math is straightforward assuming that the tickets are independently generated: finding out that you have won gives you no information about the other 599,999,999 tickets. Each ticket has 1 in 300 million chances of winning so two of them (1.999.. if you’re nitpicking) will win, on average.
Here’s another way to look at it: before finding out that you won, you didn’t know how many winners there were going to be. For all you knew, there could be 0, 2 or even 10. Once you know that you have won, you know for certain that there weren’t 0 winners – there’s at least you. In fact, knowing that you won makes worlds with more winners relatively more likely. This is because the more winners there are the more likely you are to find yourself among them! Such is the awesome powa of Bayes’ Theorem. Here’s a good detailed explanation of the theorem. The theorem itself is only useful for inconsequential things like learning anything at all based on evidence.

The charts above show the probability of Wednesday’s Powerball (635 million tickets, 1 in 292 million odds) having a certain number winners. On the left is the number of winners we could expect before the drawing: 2.17 on average. On the right is the conditional probability of having k winners given that you won, and it indeed averages to 3.17. Isn’t the discrepancy paradoxical? While each of the (few) winners will adjust their estimate of the number of winners upward from 2.17 to 3.17, each of the (numerous) losers can perform a similar calculation and adjust the expected number of winners slightly downward, to 2.169999. A small chance of updating strongly upward is balance by a huge chance of updating very slightly downward. Expected evidence is conserved, the paradox is avoided, and if you win you have to share.
So what would it take for a positive value Powerball? It would take a bit of algebra!
A $2 ticket grants a 1 in 292,201,338 chance of winning, so the expected first prize should be

Unfortunately, even without state tax you would pay federal income taxes of 39.6% which means that your expected winnings will have to total

You’ll expect to share the prize, so

Assuming all tickets are independent:
Finally, we’ll use my linear model for the expected number of tickets.

The two mega-jackpots this month generated at least 100 news items (as counted by Google) between them, so we’ll assume 50 news stories for our presumed titanojackpot. This means a jackpot of $4.1 billion, which would provide break even value for each of the 950 million tickets sold!

Don’t hold your breath. Assuming that the government reinvests 80% of revenue (it doesn’t) and that it won’t change the rules along the way (it will), the chances of a run of jackpots going from $40 million to $4.1 billion with no winner along the way are 1 in 160,000. That means that we can expect the first positive-value Powerball to happen in the year 15,692 AD! And when we get there, we’ll find that some hedge fundies have bought all the tickets beforehand.

Each person’s tickets are assumed to be independent, but they’re not uniformly distributed, right? I’d expect some kind of bias towards some choices e.g. those generated by going down a column and circling each number, because that’s a convenient way to fill it out. Then there’d be some plays such that if they win, you’re less likely to share, raising your expected winnings.
LikeLike
That’s a very good point. If you could fill a combination that’s guaranteed to be unique, you’d need a lower threshold for a positive value lottery (~$1 billion). However, for the $1.5 billion lottery you only need 20% of the people to pick unpredictable numbers (for example by letting the computer pick for them at the lotto station) to make sure that not a single combination has positive expectancy.
LikeLike
Hey! First of all: Very nice post! :)
I have a master’s in math and in my diploma thesis I modelled the state lottery where out of a pool of 45 possible numbers 6 numbers are drawn each round. As a result I know a bit about the distribution of the tickets:
1) When looking at a statistic of all playable combinations of 6 numbers (i.e. all possible tickets), sorted from most common to least common, you’ll find that the resulting distribution is incredibly skewed, much much more so than chance would suggest. In fact, the most common combination was more than three orders of magnitude more likely to be chosen than chance would suggest. So if you were to choose something like 1,2,3,4,5,6 for your ticket, you could expect to get only ~1.000 Euros of a 1.000.000 Euros prize pool.
2) People strongly preferred patterns: Rows/columns/diagonals on the ticket as well as arithmetic sequences were much much more likely to be chosen than chance would suggest.
3) Smaller numbers were more popular. The drop off was especially noticeable after 31 (which probably has a lot to do with people using numbers from birthdays).
4) A work before me showed, that even so called “quick-tickets” where the lottery computer selects the numbers for you, had a statistically significant bias to single digit numbers (why is unclear, howeve it is certainly in the interest of the lottery because it increases the likelihood of jackpots and hence the overall popularity/volume). So while it chose your numbers at random, it apparently did not choose them based on a uniform distribution.
5) Theoretically speaking you could not even model the lottery tickets as being independently drawn from each other, because a substantial number of tickets (~2 % afair) was “deterministic” in the sense that they were played reliably every round, but typically by only 1 or 2 people. The explanation for this kind of behaviour is an army of (usually) seniors, who have their one favourite ticket which they place in every round.
So if you incorporate these facts into your ticket selection strategy, you’d be able to substantially decrease the likelihood of having to share your winnings, thus substantially lowering the jackpot size at which playing the lottery becomes +EV.
LikeLike
Thanks for the education! One of my main goal with this blog is to attract and learn from people who know much more than me about whatever subject I’m blabbing about, like blastmeister on soccer and now on lotteries.
I guess the more interesting question isn’t how bad the worst numbers (i.e. 1,2,3,4,5,6) are, but how good the best ones are. This wiki page talks about a book published by two scientists who claim that the most unpopular numbers have a positive return on investment in actual lotteries which are going on which seems wildly unlikely to me based on the numbers I’ve seen. Any thoughts?
LikeLike
It’s been a couple of years since I finished my degree, so the numbers are anything but fresh in my mind (I can almost certainly look them up again though), however I can remember that my sample was roughly one year’s worth of data, which translates to ~100 rounds of that particular lottery (two drawings per week). In that sample I think there were only a handful (<10) of tickets which were not submitted at all during all those rounds and there were quite a few more which were submitted only a couple of times over the entire period.
So in effect you could probably find a ticket selection strategy that gives you a high probability that you do not have to share your prize should you indeed hit the jackpot (i.e. the bayesian update from your post would actually go in the other direction – learning that your ticket won actually makes an additional winner much less likely – oh the joy of priors! :D ).
However, I don't think that you can achieve any significant coverage (coverage = all combinations you bought / all possible combinations = probability of winning the jackpot) with such a strategy, therefore your chances of winning are still very slim and hence the opportunity cost of following the lottery / setting up any system that automatically does this are almost certainly greater than the actual payoff (which would almost certainly come at a much much later date). At least that was my conclusion back then.
On the other hand, maybe if you do it on a more global scale (look for suitable carry-over/jackpot rounds in lotteries all around the world) and also consider other tiers but the main prize, it might still have a positive EV in total *shrugs*. Then again, I don't expect the lower tier prizes to really change the picture much because:
-) As far as I know usually half the prize pool (which is usually itself only half the total money spent on tickets!), is allocated for the main tier (You have to have a big main prize to attract people).
-) A unique bet quickly loses its edge, when only a few of the numbers have to match, so your unique ticket quickly behaves just like any other ticket for less restrictive prize tiers.
So yeah, the claim in the wiki that playing all rounds of a lottery is +EV if you can play unique numbers is – at least in my mind – almost guaranteed to be bogus. You certainly have to restrict yourself to suitable carry-over/jackpot rounds. So my bayesian update when reading the claim of a net EV of +0.65 $ for unpopular numbers makes me update only a tiny bit in the direction that my math is wrong, but quite a lot more in the direction, that there is probably something wrong with the interpretation in the wiki or that I am missing some very important fact about their particular example.
LikeLike
I just realized: even if you make $1.65 on each dollar invested, but it takes 20 years to get there, that a 2.5% annual return on your money! You can do better by buying (tax free) government treasuries!
People who don’t have a lot of money and don’t know math will keep playing their birthdays, people with a master’s in math and a few tens of millions to spare on risky investments can do immeasurably better in almost any other pursuit of wealth. Quite ingeniously, lotteries are genius-proof.
LikeLike
On the 9th of January, the UK national lottery had a drawing with a much larger than usual jackpot as a result of multiple rollovers, and KPMG predicted a positive value for a ticket of about £3.20 over the £2 purchase price, based on having the same number of tickets sold as the previous draw, and that 50 million tickets would need to be sold to bring the value back down to break-even http://www.theguardian.com/science/2016/jan/09/national-lottery-lotto-drawing-odds-of-winning-maths. I haven’t managed to find out how many tickets were actually sold for that draw
LikeLike
KPMG, go home, you’re drunk.
The jackpot is 58 million and each ticket is 2 pounds. Usually, the odds of winning are 1 in 45 million, so a ticket is worth at most 1.28 (pre tax).
However, that week wasn’t actually a lottery, it was technically a raffle because the rules stipulate that at least one person had to win. If there are N tickets sold and K winners, the chance of winning is K/N and the payout to each is 58/K, so no matter how many people win, the expected value of a ticket is 58/K * K/N = 58/N. It depends only on the number sold, which makes sense for a raffle. This is only above 2 if N (total number of tickets) is below 29 million, which is quite unlikely. They mention that selling 50 million tickets would be crazy because that’s the entire adult population of the UK, but the US Powerball sold 3 tickets for each adult. Is the Guardian not aware that people are allowed to buy more than one ticket?
Ultimately, 47 million tickets were sold which means that the lotto organizers took in 94M and paid out only 58M. I wonder how much of the 36 million in clean profit they made was paid to KPMG for lying to the public and promoting the lottery.
P.S.
He guys, hey guys, guess which consulting company was hired to promote the interests of Camelot (the lottery licensee) with the UK’s National Lottery Commission?
LikeLike
Nice find on the number of tickets sold. I was wondering how much the analysis would change if you accounted for lesser prizes than the jackpot, and found this : https://www.national-lottery.co.uk/results/lotto/draw-history/prize-breakdown/2092 showing the total payout as £89,155,457 including an increased jackpot funded by the greater number of tickets sold and about £8M from valuing the lucky dip tickets for the subsequent draw awarded for matching two numbers at £2 each – and it’s still less than the £94M for selling 47M tickets.
LikeLike
Nice find by you as well, Andy. You’ve left me no choice but to unleash the sales figures for every UK lottery ever! The 95 million raised by this lottery was almost double any other lottery since 2004, maybe some hedge funds did get in on the action. I guess it did make sense for KPMG to project something like 60 mil in sales and an 80 mil prize pool.
KPMG, don’t go home, have a drink on me with my apologies.
P.S.
Isn’t it strange that both the US and the UK had their largest lotteries ever a week apart?
LikeLike
I don’t see a place to comment on the Full Archive. Maybe because it’s a page and not a post?
LikeLike
I’m a dumbass, I forgot to check that comments are activated on that page. They are now, thanks!
LikeLike