In the previous post we saw the many ways that reports about economic inequality can mislead, either by accident or in service of a political agenda. It’s crucial to get the right numbers when writing about inequality or poverty, but it’s also important to tell an instructive story. These stories usually come in two flavors: personal tales of struggle or triumph whose scope is limited to a tiny group, or dry pamphlets full of charts and statistics with some attempt at a narrative hastily attached at the end.
Neither approach answers well the basic question: who is rich and poor in America? What kind of people actually live here, and how much do they make? Is the 57th percentile of Americans by income made up of single moms with college degrees working full-time jobs, or retired couples living off social security? For the best chance of improving income, should you marry a rich spouse or go to grad school? Does income tax hurt the rich or do they make their money from capital gains? Will minimum wage help the poor or are the poorest not working anyway? We can’t draw 318 million Americans on a chart, but we can draw 100 of them and get an idea of the actual people making up the income distribution of the US. We’ll draw them using emojis.
Factorizing America
Like any complex phenomenon, there are a million factors correlating with income. Like any attempt to analyze a complex phenomenon, I will ignore 999,993 of them. But I won’t ignore 999,999. Any economic chart you see will divide people along a single characteristic (like gender or education), or two at most. To break a population down by 7 factors would require a 7-dimensional chart. That doesn’t fit on your favorite magazine’s two-dimensional page and it doesn’t fit your favorite magazine’s single dimensional narrative.
There is no source that breaks down income, taxes and transfers by age, gender, marital status, children, education, employment and net worth. So, I’ll have to make one. I let 100 avatars stand in for all American adults, assign them values for all 7 characteristics in a way that matches the distribution of each characteristic, and calculate how rich they are. Then, I can use my 100 avatars to get an idea of the distributions I can’t find, such as those that combine multiple factors.
For example: I know that 21% of US women have a 4-year college degree, 47% live with their spouses, 16% are in their fifties. All three of these correlate with higher earnings than average, but no source will tell me exactly how much a married 55-year-old woman with a Bachelor’s earns. In my model there are two women who fit all three conditions, they average an after-tax income of $63,000 a year (about 1.5x the median) and are both in the 9th decile.
I don’t know how far off that $63,000 number is from the real life average income of married, educated women in their fifties, but I’ll defend it as a reasonable guess. My 100 people are made up, but they’re made up to match as closely as possible the statistics that are available, so it’s a good bet that they match reasonably well the statistics that aren’t. This sort of educated guesswork could never be published in an economics journal, but my goal is understanding and illumination, not citations. Without further ado, here’s the full table of 100 made up American adults who are economically distributed like 242,470,820 actual American adults for 2014.
And here’s the summary in emoji form:
| Percentile | Characteristics | Adjusted Income | Randomized Income |
| 1 | 15 👩🚶💊🎮🎅 | 10,340 | 5,185 |
| 2 | 59 👩💔💊📄🎅💸 | 9,071 | 5,845 |
| 3 | 16 👨🚶💊🎮🎅 | 10,829 | 6,309 |
| 4 | 46 👨💔👶📄🎅 | 7,848 | 7,185 |
| 5 | 56 👩💑👶🎮🎅 | 8,843 | 7,444 |
| 6 | 15 👨🚶💊🎮🎅 | 10,536 | 7,645 |
| 7 | 21 👨🚶💊📜🎅 | 9,559 | 7,701 |
| 8 | 17 👩🚶💊🎮🎅💵 | 11,610 | 7,787 |
| 9 | 46 👩💑👶👶👶👶🎮👔💵 | 12,796 | 8,036 |
| 10 | 31 👩💑👶👶📖🎅 | 8,626 | 8,081 |
| 11 | 85 👩💑💊📜🎅 | 17,518 | 9,131 |
| 12 | 36 👩💑💊📖🎅💵 | 12,428 | 9,223 |
| 13 | 35 👨💔💊📄👕💸 | 13,685 | 9,530 |
| 14 | 26 👩💑💊🎓🎅💸 | 8,949 | 9,627 |
| 15 | 23 👩💑👶📜🎅 | 9,441 | 9,746 |
| 16 | 33 👨🚶💊🎮👕💵 | 14,040 | 9,912 |
| 17 | 21 👩🚶💊📜🎅 | 10,731 | 9,934 |
| 18 | 28 👨💑👶👶📜👕💵 | 15,787 | 11,028 |
| 19 | 24 👩🚶💊🎮👕 | 11,300 | 11,504 |
| 20 | 19 👩🚶💊📄🎅 | 10,047 | 11,550 |
| 21 | 40 👩🚶👶👶👶🎮🎅💵 | 7,919 | 11,646 |
| 22 | 61 👨💑💊📄🎅💵 | 12,098 | 11,707 |
| 23 | 38 👨🚶👶👶📜👔💸 | 12,951 | 12,777 |
| 24 | 18 👨🚶💊📄🎅 | 11,317 | 12,903 |
| 25 | 20 👩🚶💊📄👔💵 | 16,173 | 12,995 |
| 26 | 18 👩🚶💊📄👔💵💵 | 25,752 | 13,027 |
| 27 | 86 👨💑💊👑🎅💵 | 19,349 | 13,268 |
| 28 | 34 👩💑👶👶👶📜👔💵 | 15,947 | 13,668 |
| 29 | 31 👨💑👶📖👔 | 24,910 | 14,065 |
| 30 | 53 👨💑💊🎮🎅💵 | 12,538 | 14,540 |
| 31 | 66 👨💔💊📄🎅💵 | 20,009 | 14,619 |
| 32 | 44 👩💔👶👶👶📄🎅💵💵 | 10,800 | 14,776 |
| 33 | 52 👩💑👶👶📄🎅💵 | 10,956 | 14,975 |
| 34 | 30 👨🚶💊📄🎅💵 | 11,512 | 15,021 |
| 35 | 49 👩💔💊📜🎅 | 10,243 | 15,146 |
| 36 | 23 👨🚶💊📖👔💸 | 15,710 | 15,531 |
| 37 | 58 👩💑💊📜👔💵 | 28,109 | 15,662 |
| 38 | 30 👩🚶💊📜👔💸 | 16,603 | 15,802 |
| 39 | 17 👨🚶💊📄👔 | 15,178 | 16,124 |
| 40 | 74 👩💑💊👑🎅💵💵 | 23,524 | 16,792 |
| 41 | 65 👩🚶💊📄🎅 | 17,616 | 17,053 |
| 42 | 64 👩💑👶🎓🎅💵💵 | 13,567 | 17,979 |
| 43 | 25 👩🚶👶📄👔💵 | 14,279 | 18,429 |
| 44 | 29 👩💑👶📄👕💵 | 14,424 | 18,642 |
| 45 | 54 👨💑💊📄👔💵 | 34,405 | 18,722 |
| 46 | 38 👩💔👶👶🎓👔💵 | 23,813 | 18,729 |
| 47 | 50 👨🚶💊📄👔💵💵 | 31,093 | 20,025 |
| 48 | 71 👩💑💊📄🎅 | 16,127 | 20,077 |
| 49 | 74 👨💑💊📄🎅 | 17,372 | 20,304 |
| 50 | 41 👩💑👶👶👑👕 | 23,932 | 20,356 |
| 51 | 83 👩💔💊📄🎅💵 | 19,423 | 20,630 |
| 52 | 20 👨💑👶📄👔💵 | 16,305 | 21,112 |
| 53 | 80 👩💔💊📖🎅💵💵 | 24,257 | 22,101 |
| 54 | 45 👩🚶💊📄👔💵 | 23,503 | 22,113 |
| 55 | 33 👩💔💊📄🎅💵💵 | 20,106 | 22,602 |
| 56 | 55 👨🚶💊📖👔💸 | 25,115 | 22,856 |
| 57 | 26 👨🚶💊📜👔 | 18,255 | 23,351 |
| 58 | 28 👩🚶💊📖👔💵 | 21,074 | 23,991 |
| 59 | 43 👨🚶💊📄👔💵💵 | 30,577 | 24,269 |
| 60 | 44 👨💑💊🎮👔💵 | 22,243 | 24,562 |
| 61 | 34 👨💑👶👶📜👔💸 | 21,122 | 25,747 |
| 62 | 24 👨🚶💊📄👔💵 | 17,891 | 26,069 |
| 63 | 48 👩💑💊🎓👔💵 | 46,938 | 28,770 |
| 64 | 63 👩💔💊📖👔💵 | 29,422 | 29,468 |
| 65 | 77 👩💑💊📄🎅💵 | 20,228 | 29,754 |
| 66 | 67 👩💑💊📖🎅💵💵 | 23,158 | 31,799 |
| 67 | 49 👨💑💊📄👔💵💵 | 39,023 | 32,864 |
| 68 | 59 👨💑💊📜👔💵💵💵 | 58,888 | 33,211 |
| 69 | 36 👨💑👶📖👔 | 26,962 | 33,620 |
| 70 | 72 👨💔💊📖🎅💵💵 | 28,651 | 34,230 |
| 71 | 58 👨🚶💊📄👔💵💵💵 | 60,156 | 35,056 |
| 72 | 39 👩💑💊👑👔💸 | 58,255 | 37,925 |
| 73 | 29 👨💔💊🎓👔💸 | 30,880 | 40,563 |
| 74 | 54 👩🚶💊👑👔💵💵 | 77,598 | 43,043 |
| 75 | 51 👩💑💊🎓👔💵💵💵 | 57,471 | 45,249 |
| 76 | 81 👨💔💊📜🎅💵💵💵 | 31,581 | 46,227 |
| 77 | 35 👩🚶💊🎓👔💸 | 32,560 | 47,088 |
| 78 | 40 👨💑💊🎓👔💵💵 | 62,077 | 47,200 |
| 79 | 25 👨💑💊🎓👔💸 | 36,779 | 47,648 |
| 80 | 50 👩💑👶👶👑👔💵💵💵 | 62,861 | 48,617 |
| 81 | 70 👨💑💊📜🎅💵💵💵 | 42,567 | 51,960 |
| 82 | 60 👩💑💊🎓👔💵💵💵 | 79,630 | 54,939 |
| 83 | 64 👨💑👶📖👔💵💵💵 | 49,644 | 55,016 |
| 84 | 43 👩💑💊🎓👔💸 | 39,430 | 57,697 |
| 85 | 73 👩💔💊📄🎅💰 | 95,058 | 59,311 |
| 86 | 51 👨💑💊🎓👔 | 59,835 | 67,887 |
| 87 | 56 👨💑👶👶🎓👔💵 | 47,139 | 69,739 |
| 88 | 55 👩💑💊🎓👔💵💵💵 | 61,539 | 73,034 |
| 89 | 69 👩💔💊🎓👔💵💵 | 58,647 | 73,826 |
| 90 | 60 👨💔💊🎓👔💵💵 | 57,876 | 79,235 |
| 91 | 39 👨💑👶👶👶👑👔💵💵💵 | 66,408 | 85,320 |
| 92 | 48 👨🚶💊👑👔💸 | 62,660 | 91,752 |
| 93 | 63 👨💑💊🎓👔💵💵 | 70,339 | 101,386 |
| 94 | 61 👩💑💊👑👔💰💰 | 176,685 | 108,026 |
| 95 | 45 👨💑👶👶👶👶👑👔💵💵💵 | 82,884 | 117,090 |
| 96 | 41 👨💑👶👶👑👔💵💵💵 | 82,893 | 117,525 |
| 97 | 88 👩💔💊📜🎅💰💰 | 114,590 | 145,687 |
| 98 | 77 👨💑💊🎓👔💰 | 149,195 | 161,626 |
| 99 | 53 👩💔👶📜👔💰💰💰 | 190,059 | 227,166 |
| 100 | 68 👨💑💊👑👔💰💰💰 | 701,586 | 703,604 |
Ok, let’s break down the breakdown and see what these numbers (and emojis) mean and how I got them.
Two people to a house
The US Census counts 242 million adults living in 123 million households, almost exactly 2 adults to a household on average. Most aggregate data is at the household level, so I divide household values by 2 to get the numbers for individuals. For example, according to the Congressional Budget Office the average household makes $80,000 in market income so I adjusted the model such that each person averages $40,000.
Measures of income
I calculate four components of income: (labor income) + (wealth income) + (transfers) – (taxes), to match the breakdown used by the CBO.
Labor income depends on age, gender, family status, education and employment; we’ll address each factor in turn.
Wealth income depends on net worth, more specifically – it’s 5% of each individual’s wealth. The 5% number is a surprisingly common return on capital in many different scenarios. If your wealth is in stocks, you can reasonably hope for a long-term return of 4-5% above inflation. If your wealth is in the form of a house, the median price-to-rent ratio in US cities is around 20, so you can collect 5% of the house’s value in rent each year. Conversely, if your wealth is negative (aka debt), you’ll pay about 5% in interest on mortgages, student loans and the like.
I got the distribution of net worth from the paper by Wolff 2012, tables 1 and 4. 23% of people have negative net worth and the bottom 40% average just under -$10,000, so I gave the bottom 40 wealth amounts evenly distributed between -$50,000 and +$30,000. The third quintile goes from $30,000-$90,000, the fourth to $300,000 and the wealthiest 5% have over a million each. I multiplied the (positive or negative) net worth of every married person by 0.75, to reconcile household numbers with individual numbers, and because sharing is caring. The average individual net worth in my table is $355,000, consistent with $86.8 trillion total wealth divided among 242 million people.
Emoji-wise, 💸 is for negative net worth below -$20k, 💵 for $20-$99k, 💵💵 for $100-$299k, 💵💵💵 for $300-$999k, 💰 for $1-$2 million, 💰💰 up to $5 million and 💰💰💰 for the two people who own more than $5 million each.
Transfers comprise social security and the rest of welfare. I gave $5,700 to every person over 65 and spread the rest based on number of children and distance from the poverty line. This simplification gets the model close to the actual numbers (average transfers are only $6,700 per person, so being off isn’t a big deal) but the distribution method doesn’t accurately mirror how the government actually spreads money around to the needy.
The reason for that is that the more I studied the actual distribution of transfers in the US, the more gin and tonics I had to drink to keep my sanity. Not only is the assignment of transfers so arbitrarily complex as to be unmodelable, but it seems designed mostly to benefit lower-middle class people (21-50 percentile) at the expense of actual poor people (1-15). The third quintile by income (41-60) receive twice as much in government transfers as the bottom quintile (page 6).The bottom 15 are almost all out of the labor force (🎅), mostly unmarried (🚶, 💔), with no capability of going to college or buying a house. Policies like minimum wage, earned income tax credit, marriage tax breaks, mortgage tax breaks and college subsidies don’t help them one cent. Every policy that doesn’t help the poor ends up hurting the poor, by increasing the gap between them and the other 85%, and by blocking their social mobility and reducing their purchasing power. One of my upcoming posts will basically be a long rant about how American policies and politics are stacked against the bottom 15% to a depressing degree.
Taxes in my model are 25% of labor income plus 15% of wealth income. This doesn’t capture the monstrous complexities of the American tax system but lands the model very close to the amount of taxes actually paid by each quintile of income.
Factors affecting labor income
Most of the information below comes from the US Census data on families and living arrangements, and from the Census data on income and poverty. Wherever I don’t specify a source for the data, it’s one of those.
I. Age is represented as a number in each cell. I aggregated the employed Americans by age and earnings group. Earnings grow quickly in people’s twenties and thirties, reach a peak in the early fifties and decline gradually after that, perhaps because people at the highest paying jobs can afford to retire. Here’s how this income curve looks by decile, courtesy of Townhall Finance:
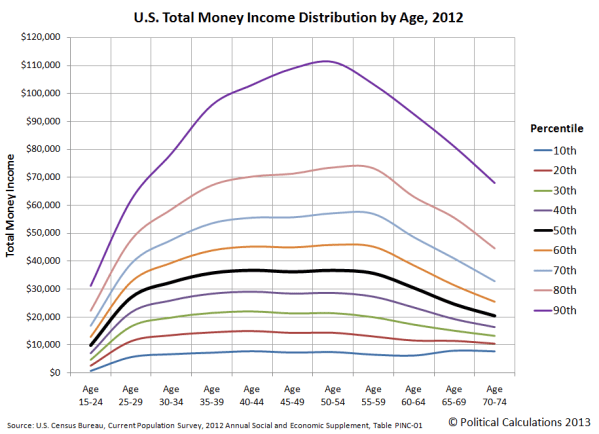
A U-shaped curve (upside down in our case) is a sign to try a quadratic regression, tracking how income changes with age and age squared. The regression fits very well, showing a salary increase of 5% per year of age (this describes the sharp rise for young people) and a salary decrease of 0.05% per age squared. The ratio of these coefficient is 100. What does that tell us? Above the age of 50, adding 1 year to age adds at least 100 to the square of age (51^2 – 50^2 = 101) so the negative impact of age^2 becomes stronger than the positive impact of age after 50, and earnings go down.
It’s important to note that throughout this exercise I’m using correlations, not looking for causation. I want my model to include the fact that 50-year-old people earn a lot of money, I don’t care why that is so. It’s hard to think of “age squared” as an explanatory variable, and it isn’t. It’s just a tool to account for the fact that earnings start slowly dipping past a certain point.
II. I really want to emphasize the correlations-not-explanation point when talking about gender (👩 / 👨). If you’ve seen a single income statistic in your life, it’s probably the one about women earning 79 cents on a man’s $1. And if you’ve seen that number, you’ve seen in taken out of context in a dazzling variety of ways. Here’s the actual context: out of 242 million adults, the census counts 62 million men (about half of all men) who are employed year-round, and 46 million women (only a third). The average salary of these women is 79% that of the men. This number doesn’t control for industry, occupation, hours worked, qualification, extra-salary benefits, or the 133 million people who aren’t included in the statistic. The only thing from the above that I include in my model is education: women achieve slightly higher education attainment on average, but I also know that there are less women in business schools than in nursing schools. I decided to just use 79% as the gender adjustment for employed workers with no modification.
I am making no claim about the causes of this disparity. Maybe there’s a conspiracy of sexist men to underpay women and send them back to the kitchen. Maybe there’s a conspiracy of lazy women to mooch off their husbands. No one knows, no matter how many people claim that they do. One of my readers, herself a highly intelligent woman earning a high salary in a quantitative field, asked me to write about possible explanations for the wage gap. I can only assume that she wants to get me fired so that she can take over this blogging corner. My impression from a cursory glance at wage gap studies is that the amount of useful data is swamped by politically motivated researchers on both sides finding exactly the numbers that support their positions, time after time. I refuse to even venture close to this field, for fear of catching some nasty infection of my reasoning faculties.
III. I look at three types of marital status: married and living with your spouse (💑), never married (🚶) and everyone who was previously married but is now divorced/widowed/separated (💔). Married people tend to be older (and thus richer), so I controlled for age by looking only at the incomes of people between the ages of 35-65. Marriage rates in this age range are basically stable.
Getting hitched has little impact on the earnings of employed women: they make about 6% more than single ladies. For men, however, the effect is huge: previously married men make 74% of what cohabiting husbands do, and bachelors make less than 68%. Why? Your guess is as good as mine. OK, it’s not as good as mine: my guess is that men with a wife waiting at home find reasons to stay an extra hour or two at work and are rewarded accordingly. But your guess is probably as reasonable as mine.
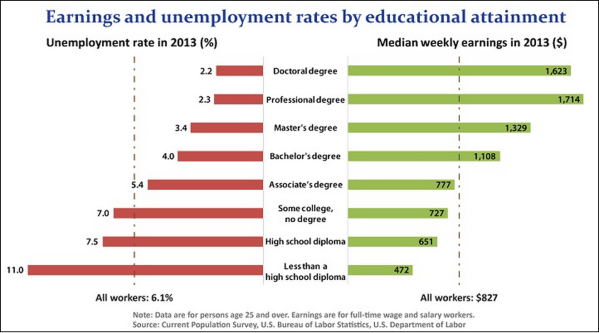
IV. I used the statistics of educational attainment from the census and from Pew Research, aggregated into 6 levels: advanced degrees (👑), Bachelor’s (🎓), Associate’s (📖), some college (📜), high school diploma (📄) and no high school (🎮).
The incomes of each group relative to the median are provided by the Bureau of Labor Statistics. Instead of using ratios like I did for gender, age and marriage, I added the absolute difference of each group’s earnings to median, since each level of education opens up a new layer of available jobs. People with advanced degrees work at jobs that pay $41,600 more than the median, Bachelor’s jobs pay $14,820 more and jobs for high school dropout pay $18,460 less.
V. Finally, you don’t make a labor income if you ain’t got a job (👔). 40% of Americans 15+ are out of the labor force (🎅): retirees, students and some people in between like housewives. Of the remaining 60%, about 5% are unemployed (👕) at any given time and the average unemployment duration is half a year. Since we’re looking at income over a year, I picked 6 people (10% of 60) to be unemployed based on education and family status and divided their yearly labor income by half. To be precise, I multiplied it by half. Or divided by two. You get my drift.
Children
The average American adult is responsible for 0.3 children, a unit of measure usually called “a dog”. I used the CBO adjustment for household size, and assumed that a cohabiting spouse takes care of half the children in the house. Long story short, if you’re raising two kids by yourself (👶👶) you have about half the effective income of someone who isn’t (💊).
Luck (and the other 999,992 factors)
When you try to explain real world income data with a limited set of variables, you inevitably end up with unexplained variance: all the factors behind why one person is richer than another that you didn’t account for. These can either be the variables you didn’t include (for example, I didn’t want to get into race and geography). Or, it can be the effect of random shit happening. So if I’m generating fake world data based on a limited set of variables, I also included a random-shit-happens component: multiplying the expected income by a number between 0.5 and 1.5.
To summarize: adjusted income is what each person should be making based on age, gender, family status, education and employment. Randomized income is that income, only randomized. Got it? Because these income numbers are for individuals (not households) and include wealth, transfers and taxes, they won’t look quite like what you’ll see in other tables. But, they match the macro-characteristics: the distance between the percentiles and the types of people in each one.
It’s fun (at least for me) to make up narratives about these people. Is the lady at #99 with no college degree but a decent income and a lot of wealth the widow of a millionaire? Or is she an actress who was famous in her youth and saved up some cash? Did the guy at #52 forego college because he had a kid at 19 or because he enjoys his job in a car repair shop? Is the working mother of four at #9 an immigrant in El Paso or a religious farmer in Idaho? These are 100 fake Americans, and together they’re the real America.
| Percentile | Characteristics | Adjusted Income | Randomized Income |
| 1 | 15 👩🚶💊🎮🎅 | 10,340 | 5,185 |
| 2 | 59 👩💔💊📄🎅💸 | 9,071 | 5,845 |
| 3 | 16 👨🚶💊🎮🎅 | 10,829 | 6,309 |
| 4 | 46 👨💔👶📄🎅 | 7,848 | 7,185 |
| 5 | 56 👩💑👶🎮🎅 | 8,843 | 7,444 |
| 6 | 15 👨🚶💊🎮🎅 | 10,536 | 7,645 |
| 7 | 21 👨🚶💊📜🎅 | 9,559 | 7,701 |
| 8 | 17 👩🚶💊🎮🎅💵 | 11,610 | 7,787 |
| 9 | 46 👩💑👶👶👶👶🎮👔💵 | 12,796 | 8,036 |
| 10 | 31 👩💑👶👶📖🎅 | 8,626 | 8,081 |
| 11 | 85 👩💑💊📜🎅 | 17,518 | 9,131 |
| 12 | 36 👩💑💊📖🎅💵 | 12,428 | 9,223 |
| 13 | 35 👨💔💊📄👕💸 | 13,685 | 9,530 |
| 14 | 26 👩💑💊🎓🎅💸 | 8,949 | 9,627 |
| 15 | 23 👩💑👶📜🎅 | 9,441 | 9,746 |
| 16 | 33 👨🚶💊🎮👕💵 | 14,040 | 9,912 |
| 17 | 21 👩🚶💊📜🎅 | 10,731 | 9,934 |
| 18 | 28 👨💑👶👶📜👕💵 | 15,787 | 11,028 |
| 19 | 24 👩🚶💊🎮👕 | 11,300 | 11,504 |
| 20 | 19 👩🚶💊📄🎅 | 10,047 | 11,550 |
| 21 | 40 👩🚶👶👶👶🎮🎅💵 | 7,919 | 11,646 |
| 22 | 61 👨💑💊📄🎅💵 | 12,098 | 11,707 |
| 23 | 38 👨🚶👶👶📜👔💸 | 12,951 | 12,777 |
| 24 | 18 👨🚶💊📄🎅 | 11,317 | 12,903 |
| 25 | 20 👩🚶💊📄👔💵 | 16,173 | 12,995 |
| 26 | 18 👩🚶💊📄👔💵💵 | 25,752 | 13,027 |
| 27 | 86 👨💑💊👑🎅💵 | 19,349 | 13,268 |
| 28 | 34 👩💑👶👶👶📜👔💵 | 15,947 | 13,668 |
| 29 | 31 👨💑👶📖👔 | 24,910 | 14,065 |
| 30 | 53 👨💑💊🎮🎅💵 | 12,538 | 14,540 |
| 31 | 66 👨💔💊📄🎅💵 | 20,009 | 14,619 |
| 32 | 44 👩💔👶👶👶📄🎅💵💵 | 10,800 | 14,776 |
| 33 | 52 👩💑👶👶📄🎅💵 | 10,956 | 14,975 |
| 34 | 30 👨🚶💊📄🎅💵 | 11,512 | 15,021 |
| 35 | 49 👩💔💊📜🎅 | 10,243 | 15,146 |
| 36 | 23 👨🚶💊📖👔💸 | 15,710 | 15,531 |
| 37 | 58 👩💑💊📜👔💵 | 28,109 | 15,662 |
| 38 | 30 👩🚶💊📜👔💸 | 16,603 | 15,802 |
| 39 | 17 👨🚶💊📄👔 | 15,178 | 16,124 |
| 40 | 74 👩💑💊👑🎅💵💵 | 23,524 | 16,792 |
| 41 | 65 👩🚶💊📄🎅 | 17,616 | 17,053 |
| 42 | 64 👩💑👶🎓🎅💵💵 | 13,567 | 17,979 |
| 43 | 25 👩🚶👶📄👔💵 | 14,279 | 18,429 |
| 44 | 29 👩💑👶📄👕💵 | 14,424 | 18,642 |
| 45 | 54 👨💑💊📄👔💵 | 34,405 | 18,722 |
| 46 | 38 👩💔👶👶🎓👔💵 | 23,813 | 18,729 |
| 47 | 50 👨🚶💊📄👔💵💵 | 31,093 | 20,025 |
| 48 | 71 👩💑💊📄🎅 | 16,127 | 20,077 |
| 49 | 74 👨💑💊📄🎅 | 17,372 | 20,304 |
| 50 | 41 👩💑👶👶👑👕 | 23,932 | 20,356 |
| 51 | 83 👩💔💊📄🎅💵 | 19,423 | 20,630 |
| 52 | 20 👨💑👶📄👔💵 | 16,305 | 21,112 |
| 53 | 80 👩💔💊📖🎅💵💵 | 24,257 | 22,101 |
| 54 | 45 👩🚶💊📄👔💵 | 23,503 | 22,113 |
| 55 | 33 👩💔💊📄🎅💵💵 | 20,106 | 22,602 |
| 56 | 55 👨🚶💊📖👔💸 | 25,115 | 22,856 |
| 57 | 26 👨🚶💊📜👔 | 18,255 | 23,351 |
| 58 | 28 👩🚶💊📖👔💵 | 21,074 | 23,991 |
| 59 | 43 👨🚶💊📄👔💵💵 | 30,577 | 24,269 |
| 60 | 44 👨💑💊🎮👔💵 | 22,243 | 24,562 |
| 61 | 34 👨💑👶👶📜👔💸 | 21,122 | 25,747 |
| 62 | 24 👨🚶💊📄👔💵 | 17,891 | 26,069 |
| 63 | 48 👩💑💊🎓👔💵 | 46,938 | 28,770 |
| 64 | 63 👩💔💊📖👔💵 | 29,422 | 29,468 |
| 65 | 77 👩💑💊📄🎅💵 | 20,228 | 29,754 |
| 66 | 67 👩💑💊📖🎅💵💵 | 23,158 | 31,799 |
| 67 | 49 👨💑💊📄👔💵💵 | 39,023 | 32,864 |
| 68 | 59 👨💑💊📜👔💵💵💵 | 58,888 | 33,211 |
| 69 | 36 👨💑👶📖👔 | 26,962 | 33,620 |
| 70 | 72 👨💔💊📖🎅💵💵 | 28,651 | 34,230 |
| 71 | 58 👨🚶💊📄👔💵💵💵 | 60,156 | 35,056 |
| 72 | 39 👩💑💊👑👔💸 | 58,255 | 37,925 |
| 73 | 29 👨💔💊🎓👔💸 | 30,880 | 40,563 |
| 74 | 54 👩🚶💊👑👔💵💵 | 77,598 | 43,043 |
| 75 | 51 👩💑💊🎓👔💵💵💵 | 57,471 | 45,249 |
| 76 | 81 👨💔💊📜🎅💵💵💵 | 31,581 | 46,227 |
| 77 | 35 👩🚶💊🎓👔💸 | 32,560 | 47,088 |
| 78 | 40 👨💑💊🎓👔💵💵 | 62,077 | 47,200 |
| 79 | 25 👨💑💊🎓👔💸 | 36,779 | 47,648 |
| 80 | 50 👩💑👶👶👑👔💵💵💵 | 62,861 | 48,617 |
| 81 | 70 👨💑💊📜🎅💵💵💵 | 42,567 | 51,960 |
| 82 | 60 👩💑💊🎓👔💵💵💵 | 79,630 | 54,939 |
| 83 | 64 👨💑👶📖👔💵💵💵 | 49,644 | 55,016 |
| 84 | 43 👩💑💊🎓👔💸 | 39,430 | 57,697 |
| 85 | 73 👩💔💊📄🎅💰 | 95,058 | 59,311 |
| 86 | 51 👨💑💊🎓👔 | 59,835 | 67,887 |
| 87 | 56 👨💑👶👶🎓👔💵 | 47,139 | 69,739 |
| 88 | 55 👩💑💊🎓👔💵💵💵 | 61,539 | 73,034 |
| 89 | 69 👩💔💊🎓👔💵💵 | 58,647 | 73,826 |
| 90 | 60 👨💔💊🎓👔💵💵 | 57,876 | 79,235 |
| 91 | 39 👨💑👶👶👶👑👔💵💵💵 | 66,408 | 85,320 |
| 92 | 48 👨🚶💊👑👔💸 | 62,660 | 91,752 |
| 93 | 63 👨💑💊🎓👔💵💵 | 70,339 | 101,386 |
| 94 | 61 👩💑💊👑👔💰💰 | 176,685 | 108,026 |
| 95 | 45 👨💑👶👶👶👶👑👔💵💵💵 | 82,884 | 117,090 |
| 96 | 41 👨💑👶👶👑👔💵💵💵 | 82,893 | 117,525 |
| 97 | 88 👩💔💊📜🎅💰💰 | 114,590 | 145,687 |
| 98 | 77 👨💑💊🎓👔💰 | 149,195 | 161,626 |
| 99 | 53 👩💔👶📜👔💰💰💰 | 190,059 | 227,166 |
| 100 | 68 👨💑💊👑👔💰💰💰 | 701,586 | 703,604 |

I have a few comments:
1: When you talk about 242 million adults living in the United States, I was initially confused because I didn’t notice that you were talking about adults and wondered why you were using such a low figure for the population of the United States. I caught it the second time you used this figure. I am leaving this comment in case anyone finishes reading and is still confused by the number and to let you know of my confusion.
2: On the section on transfers: I’ve been following politics since I was in elementary school. I wouldn’t have seen it then but it’s abundantly clear to me now that politicians that talk about inequity and those worse off financially, don’t do a lot to positively effect those who could use public assistance the most. The talk about serving the “middle class” is clear enough on this and I cringe every time I hear a politician say it. This is true on the local, state, and federal level and clear to me at-least.
Another question on transfers: how do you count tax expenditures? Is this counted in the transfer section, is this reflected in the 25% tax on labor 15% tax on wealth, by some other mechanism, a combination, or not at all?
3: It is a bit confusing when you talk about the impact on marital status on income. This stems from using percentages in two different ways and exacerbated by the emphasis on the percentages themselves. For woman you talk about marrying providing a 6% increase in income but with men you talk about having an income of 74% or 68% of the income of a married man. It would be clearer, in my opinion, to say that men see a 47% increase in their income when marrying and a 26% drop in income when divorcing or to say that never married women make 94% of married women.
4: “When you try to explain real world income data with a limited set of variables, you inevitably end up with unexplained variance: all the factors behind why one person is richer than another that you didn’t account for… adjusted income is what each person should be making based on age, gender, family status, education and employment. Randomized income is that income, only randomized. Got it?”
No, I don’t. By what mechanism did you randomize it and why? Without hearing your reason it would make more sense to me to look at the expectation itself instead of some random deviation. I’m also not entirely sure what you did to get the table and since I need to leave not to long from now, I can’t put in the effort to reverse engineer it at the moment. Did you fit demographics to the income you calculated or did you calculate a person’s income based on demographics and how exactly? The publicly available spreadsheet is bereft of formulas and I don’t have time at present to figure out what you did. Perhaps a dry technical description of the procedure you used would help…
5: It wasn’t initially clear what the difference between ain’t got a job and out of the labor force is. Looking at your excel file it seams that the division is between employed (shirt with tie), unemployed (shirt without tie), and out of the labor force (santa), which would mean that unemployed is unemployed but looking for work and that your description of the emoticon’s is wrong. Oh I get it now… The way you worded it confused me and it might confuse others (as in the “ain’t got a job” phrase only the “got a job” part refers to the emoticon).
6: This seams not to be the second part as advertised in the first part. I don’t see a lot of exploration about how people are harmed by inequality. I don’t see why this chart is valuable. Looking at it (I don’t have time to do regressions right now), it seams that employment and income are strongly correlated with how much money one makes, marital status appears to be correlated, and number of children not so much. The chart wouldn’t be necessary to discover these things (in fact you did discover them before making the chart). Is this just an tool to help answer the question of what are the consequences of economic inequality? Is there another purpose for the chart? I mean beyond the joy of making charts that is…
I appear to be confused by a lot of this post. It could be poor reading comprehension on my part and/or poor writing on yours. I will look at it some more later and maybe I can clear up some of my confusion…
LikeLike
Okay there are a few things I’m confused about. I will state my general confusion first then state my specific confusion.
General confusion:
What has happened with the inequality sequence? Is it over? There are three posts but they’re not the three posts that were initially promised and we were also promised more about taxation in the last post on inequality. I am okay with changing the road map or abandoning a project after discovering that it’s not worth the effort once attempted and one has more information on what is one doing. Between the three places I need to look for new content on Put A Num On It and where each post on inequality seams to go, I’m just confused about what is going on with this topic.
You haven’t discussed how economic inequality causes harm. The best this post does is discuss who is harmed (more confusion about this post bellow). This post doesn’t answer questions such as is a poor person in the US likely to have longer or shorter life expectancy then a rich person (I suspect the answer is shorter) or even are they likely to spend more or less days in the hospital over their life then a rich person? The later is a more interesting question to me then the former because I can BS reasons for either answer: poor people are less likely to prevent major illness through lifestyle and preventative care and thus more likely to need hospitalization to rich people can better pay for hospitalization and thus more likely to be in the hospital when they need or want to be (for say an elective procedure). Answering questions such as this would be exploring how inequality causes harm.
We also don’t have promised policy solutions and/or critiques of currently proposed solutions. You pointed out that there is likely a way to change tax structure to both collect more money from the rich in the US while changing incentives to allow the rich to perform better social service but a specific way has not been proposed in these pages. I’m okay with there not being such, I am merely asking: what are the current plans on the inequality sequence?
Specific confusion:
I had mostly made a reverse engineering of this post but lost it over the past month-in-a-half when other things diverted my attention from Put A Num On It. I also don’t see it worthwhile to recreate my lost hours of work. I did figure out that you likely created a random sample of 100 people contestant with the 7 demographic factors you looked at with respect to the American population. You then discovered how each of these 7 factors effects income specifically. You then applied these individual effects to the 100 sample people and got an income distribution. You then stooped, unfinished in doing anything useful with respect to understanding inequality.
You didn’t quite stop there. You added in a randomization factor that I am now convinced didn’t add any useful information while destroying useful information. We are left with conclusions such as, if this model is useful then being out of the labor force is detrimental to income when a premise of the model is being out of the labor force is detrimental to income. What would be useful is once having an income distribution created using this method, if you would compare this distribution to the actual measured income distribution of Americans. With significant agreement then you could conclude that the model is useful. That is that, when averaged over large number of people, these 7 demographic factors allow one to make a good prediction of a person’s income. This has useful information but without such a comparison, I don’t see useful information here. This could be my failing.
I also point out that I counted a dozen or so degrees of freedom when making this model. I question whether 100 sample people are enough to evaluate this model with so much choice. It may be helpful to calculate the experiamental power of this model given the number of people simulated. It would then be useful to compare the derived income distribution to the real income distribution (without destroying information in doing so) to see if the model works. If it does then that is useful information. If it does not then that is useful information. I am still confused as to the utility of this exercise otherwise.
LikeLike
zomg I am famous. _yes_
p.s. Nice post, +10 on the emojis. Kind of want more math, but then that might scare off some readers.
LikeLike